Experiment Name: Verification of Bernoulli’s Equation.

Figure:- Experimental Setup
Objective:
(i) To find the validity of the Bernoulli’s equation for steady flow of water in a tapered duct.
(ii) To evaluate the different component of mechanical energy possessed by a fluid element at different section of the duct during flow.
Visit our New WEBSITE For more helpful article-
"WELDING TERMINOLOGIES AND ITS DEFINITION"
Apparatus Used:
The apparatus consists of a rectangular flow channel, which is tapered along the length. Flow area at inlet is maximum and it goes on decreasing upto the minimum value and then again increases to maximum at the outlet. Water is supplied to flow channel through direct pipe inlet connection. Outlet is directly connected to measuring unit.
Theory:
Bernoulli's Principle is named in honor of Daniel Bernoulli. This principle is the basis of Bernoulli's equation along a streamline, which states that the sum of all forms of energy in a fluid flowing along an enclosed path (a streamline) is the same at any two random points in that path.
When an incompressible fluid is flowing through a closed conduit, it may be subjected to various forces, which cause change of velocity, acceleration or energies involved. The major forces involved are classified as surface force and body forces. Due to change in cross section area of flow, velocity of fluid may change and pressure also changes at the same time. In short, if kinetic energy of fluid is raised, its pressure or flow energy will reduce so that total energy of fluid is constant at any two points along the flow path, for a steady, incompressible fluid flow.
Bernoulli's Principle is essentially a work energy conservation principle which states that for an ideal fluid or for condition where effects of viscosity are neglected, with no work being done on the fluid, total energy remains constant.
Hence, when applied to steady, incompressible, inviscid flow of fluids (i.e. ideal fluid flow) we can write,
P/ρg + V²/2g + z = Constant=H (Total Head)
Where P/ρg + z = Piezometric Head= h+h1
h = Water rise upto free surface level from top of the channel at zero mark in piezometer tube,
h1 = Distance from the duct center axis to the zero mark at top of channel. (Take it from given chart)
P = pressure,
V = average velocity at the section,
ρ=density of fluid,
g=gravitational acceleration,
V²/2g= Kinetic Head,
z = Potential head or Datum Head.
Experimental procedure:
1. Fill-up water tank, connected to flow channel.
2. Open the inlet valve, located at end of flow channel and allow the water to flow from supply tank.
3. Reduce flow by inlet gate valve, so that there is only a small rise of water in the last pressure tapping.
4. Now adjust the flow, so that we get a constant head in the supply tank to make flow in and flow out equal.
5. Allow the levels to stabilize in the piezometric tubes and take the readings of the heads.
6. Close outlet valve of the measuring tank, and measure the time to rise water level by a certain level in volumetric tank, at exit from flow channel. This will give the discharge rate through the flow
channel.
7. Now, repeat the procedure by changing the discharge rate, and note the drop of head at outlet for different observation.
[Ad1]
Observations: (Two Sample reading for different flow rate shown below)
For horizontal position of flow passage, the datum level is taken as centre axis of the flow channel, putting z=0 there, as reference level.
Area of Volumetric Tank= 0.15×0.15=0.0225 m2
Note:-
1. Here h is measured from experiment and h1 is taken from given chart. After calculating summation direct reading is written on the table below.
2. Rise of water level is taken as 0.1 m. Multiplying this rise of water level with area of tank we get the volume of water collected in tank in m3.
3. Area for each reading is calculated from the given table.
4 Finally our goal is to show that total head is approximately same for all readings.
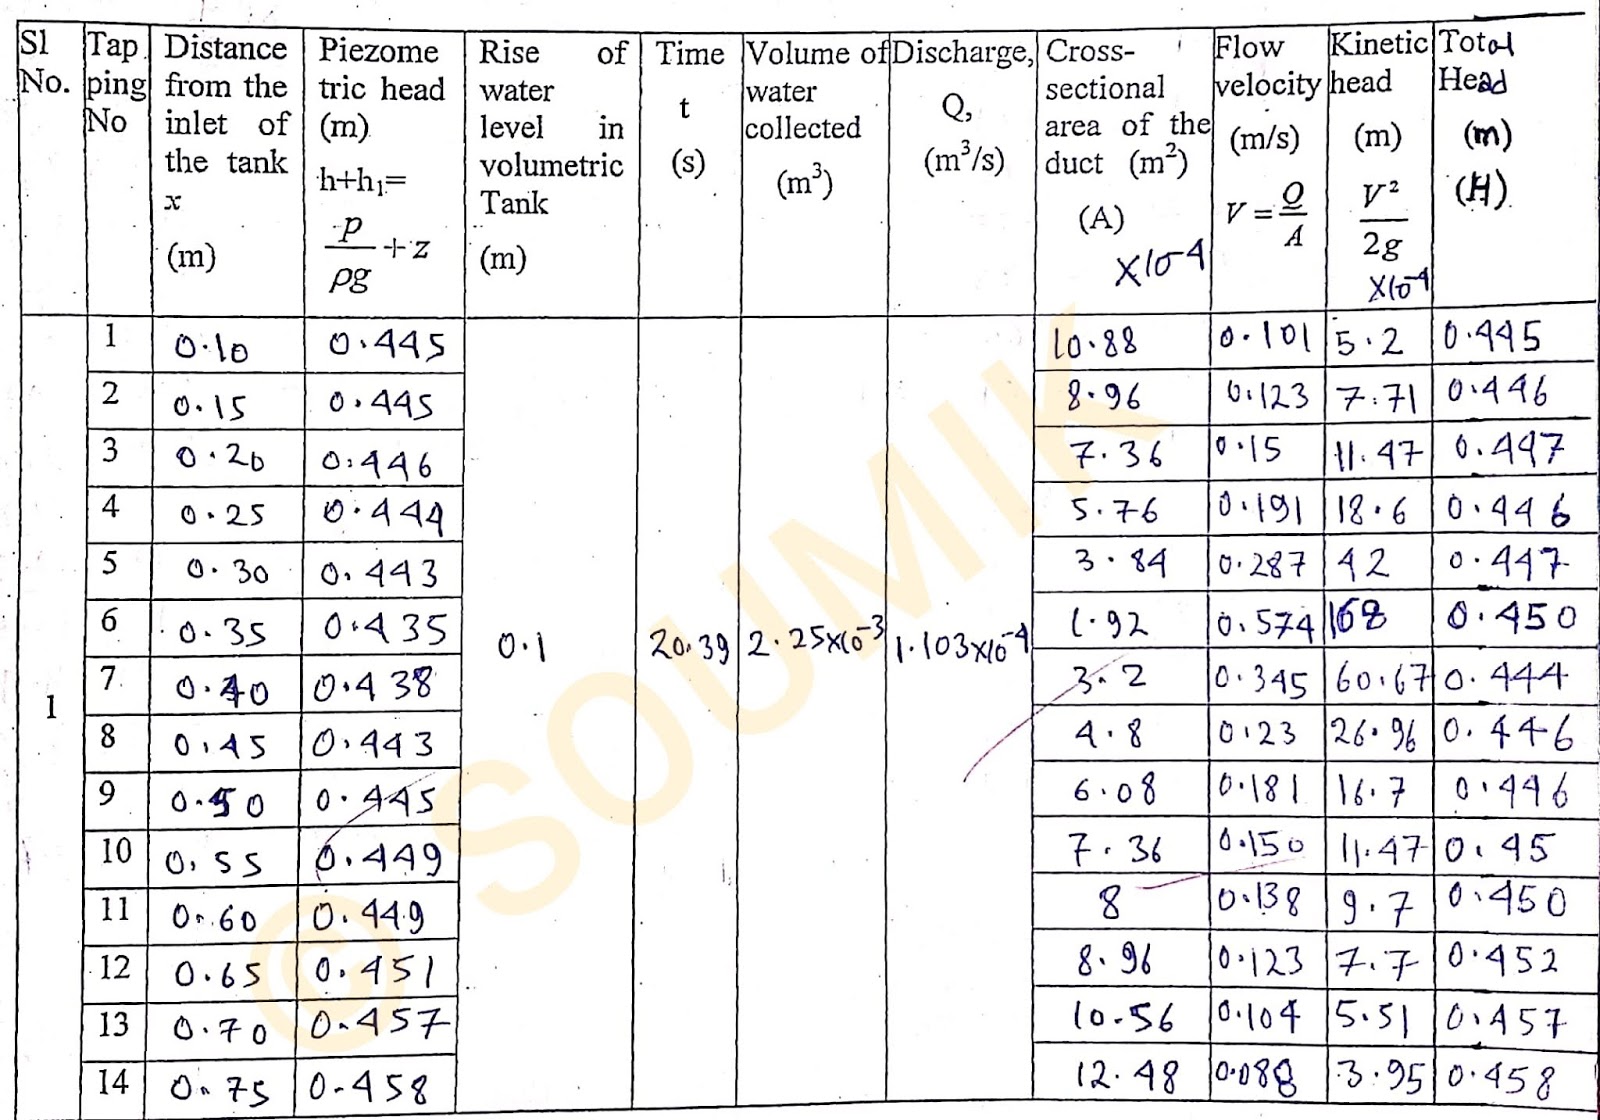
1st Observation.

2nd Observation.

Given Table (To be provided to perform this experiment).
Required Graph to be plotted:
1. Length vs Piezometric Head along the length of the duct.
2. Length vs Kinetic Head along the length of the duct.
3. Length vs Total energy head (H) along the duct.
Note:- All graphs are drawn on the same graph paper for better understanding.To draw a continuous proper graph some point of reading is to be ignored. Corresponding readings taken from 1st Observation table above.

FAQ:
1. Draw the schematic diagram of the setup.

2. Provide sample calculation.

3. Explain Hydraulic Grade Line (HGL) and Total Grade Line (TGL).

Hydraulic grade line is a line representing the total head available to the the fluid minus the velocity head can be expressed as HGL= P/ρg + z.
Total grade line is a line that represent the total head (pressure head + velocity head + potential head) available to the fluid can be expressed as
TGL= (P/ρg + z) + V²/2g.
4. Write down the Bernoulli’s equation for Real Fluid.
it states that the sum of pressure head, kinetic head and potential head of a fluid particle is constant along a steam line during steady flow when compressibility and frictional effect are negligible.
Total Head= P/ρg + V²/2g + z = Constant
Where P/ρg= pressure head
V²/2g=kinetic head,
z =datum head or potential head.
5. State the assumptions made to use Bernoulli’s equation from Euler’s equation.
i) Fluid must be ideal that is viscosity is zero.
ii) Flow is continuous,steady and along the streamline.
iii) Fluid must be incompressible.
iv) The velocity of flow is uniform over the section.
Written by- SOUMIK.